200-SMA and 2-RSI Trading Strategy
This Python script implements a backtesting simulation for a simple trading strategy using two common technical indicators: the 200-day Simple Moving Average (SMA) and a 2-period Relative Strength Index (RSI). The strategy is designed to identify and capitalize on potential buy and sell signals based on the confluence of these indicators.
How the Strategy Works
The core of this strategy lies in its specific entry and exit conditions:
- Buy Signal (Entry): A buy signal is generated when the stock’s closing price crosses above the 200-day SMA, and the 2-period RSI is below 10. This combination aims to identify a strong upward trend (Close > SMA_200) on a potential pullback (RSI < 10), suggesting a possible buying opportunity.
- Sell Signal (Exit): A sell signal is triggered when the stock’s closing price for the current day is greater than the high of the previous day. This condition serves as a simple trailing stop or profit-taking mechanism, exiting the position once a new short-term high is made.
Key Features
- Customizable Ticker: The script allows you to easily change the stock symbol (ticker_symbol) to backtest the strategy on any stock available on Yahoo Finance.
- Backtesting Framework: It simulates the strategy’s performance over historical data, calculating the change in equity and providing key metrics like initial capital, final equity, and total return.
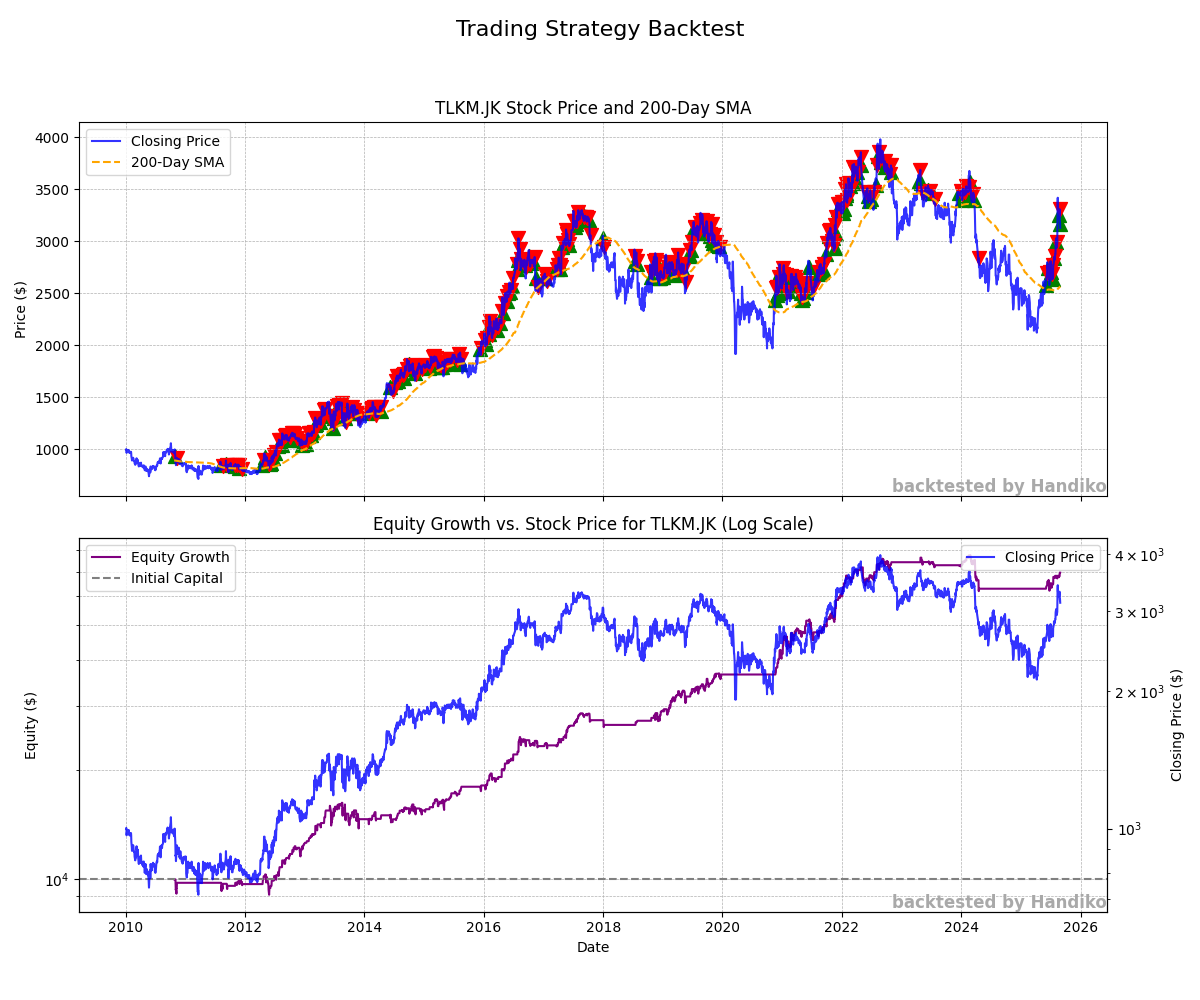
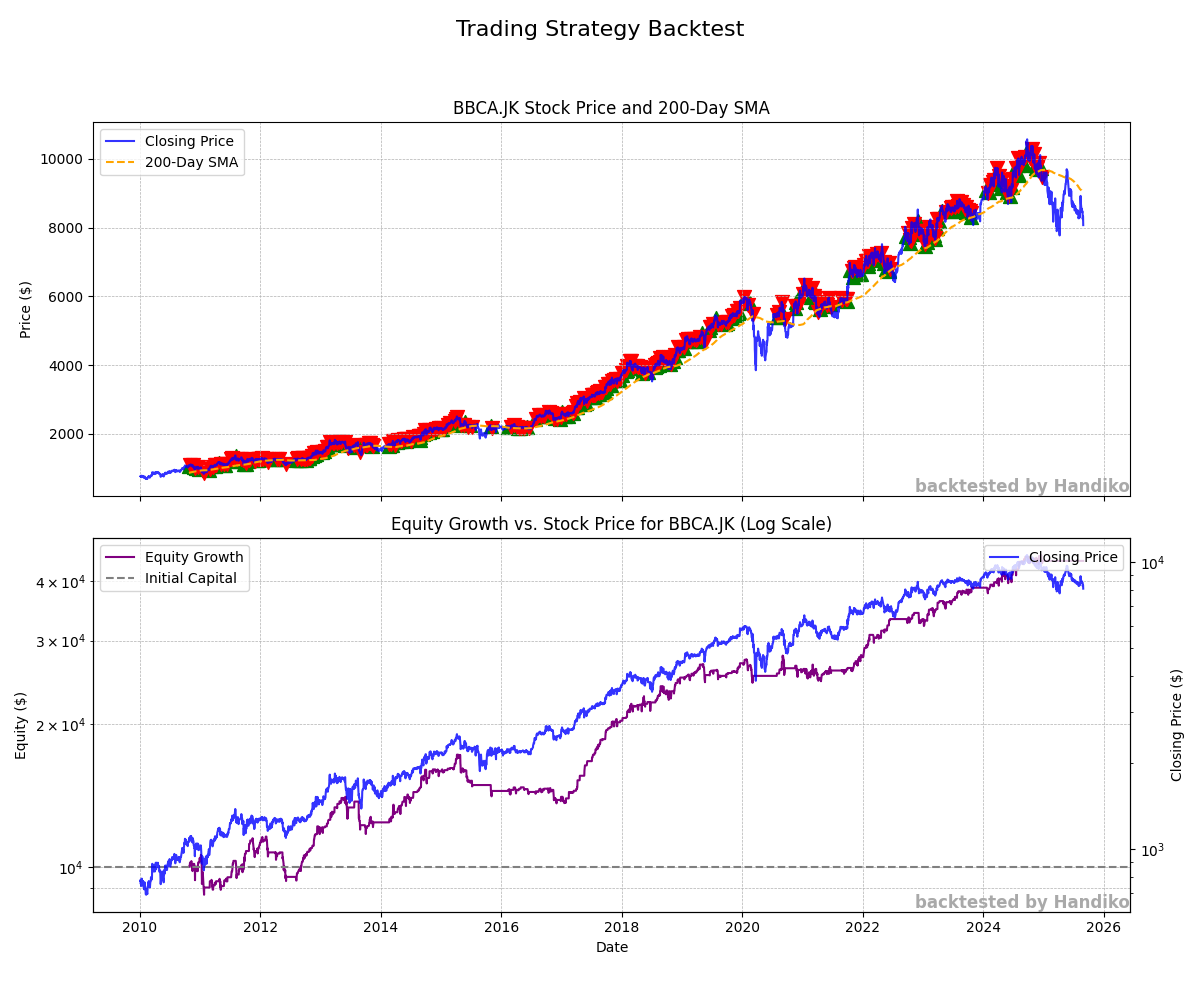
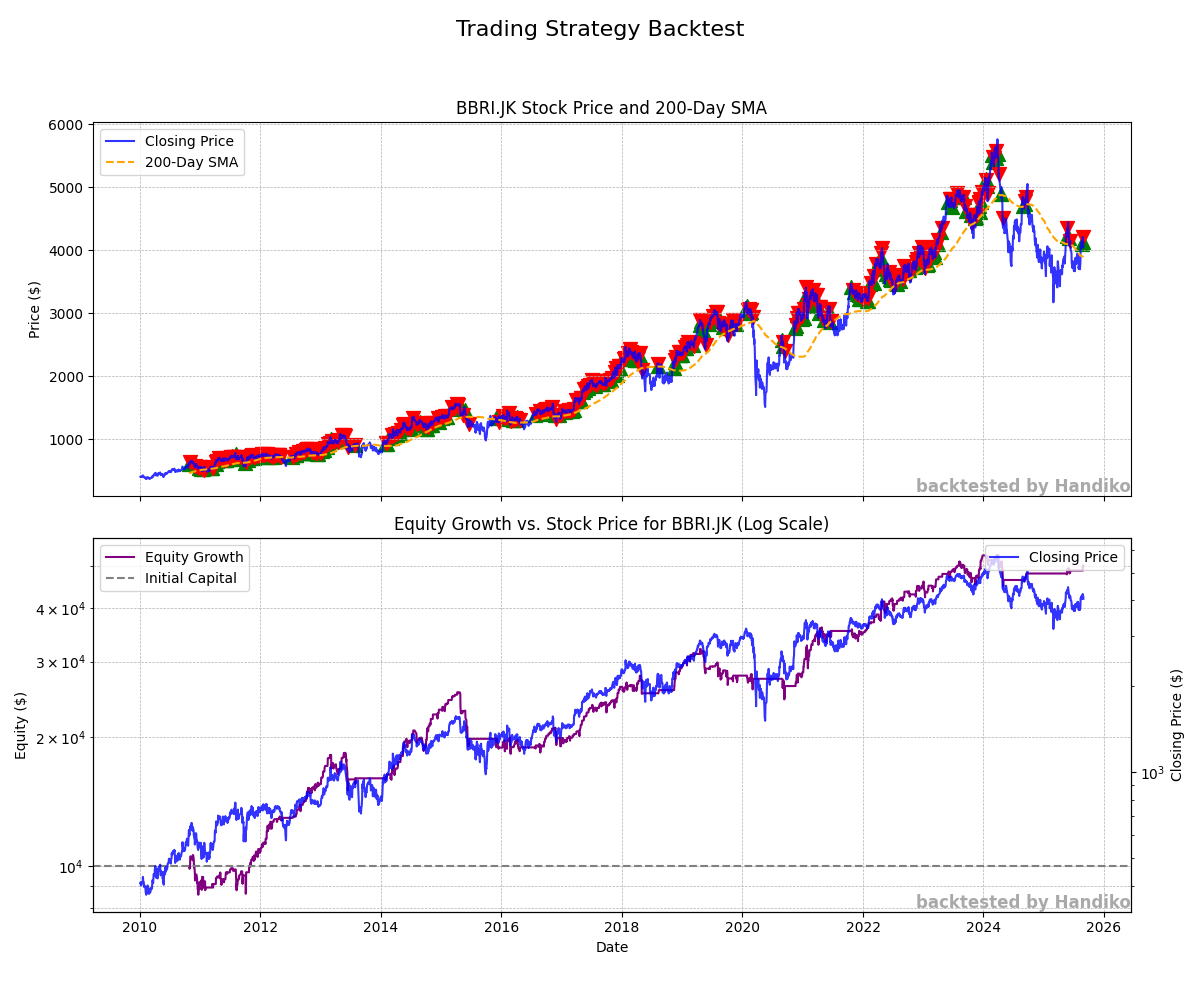
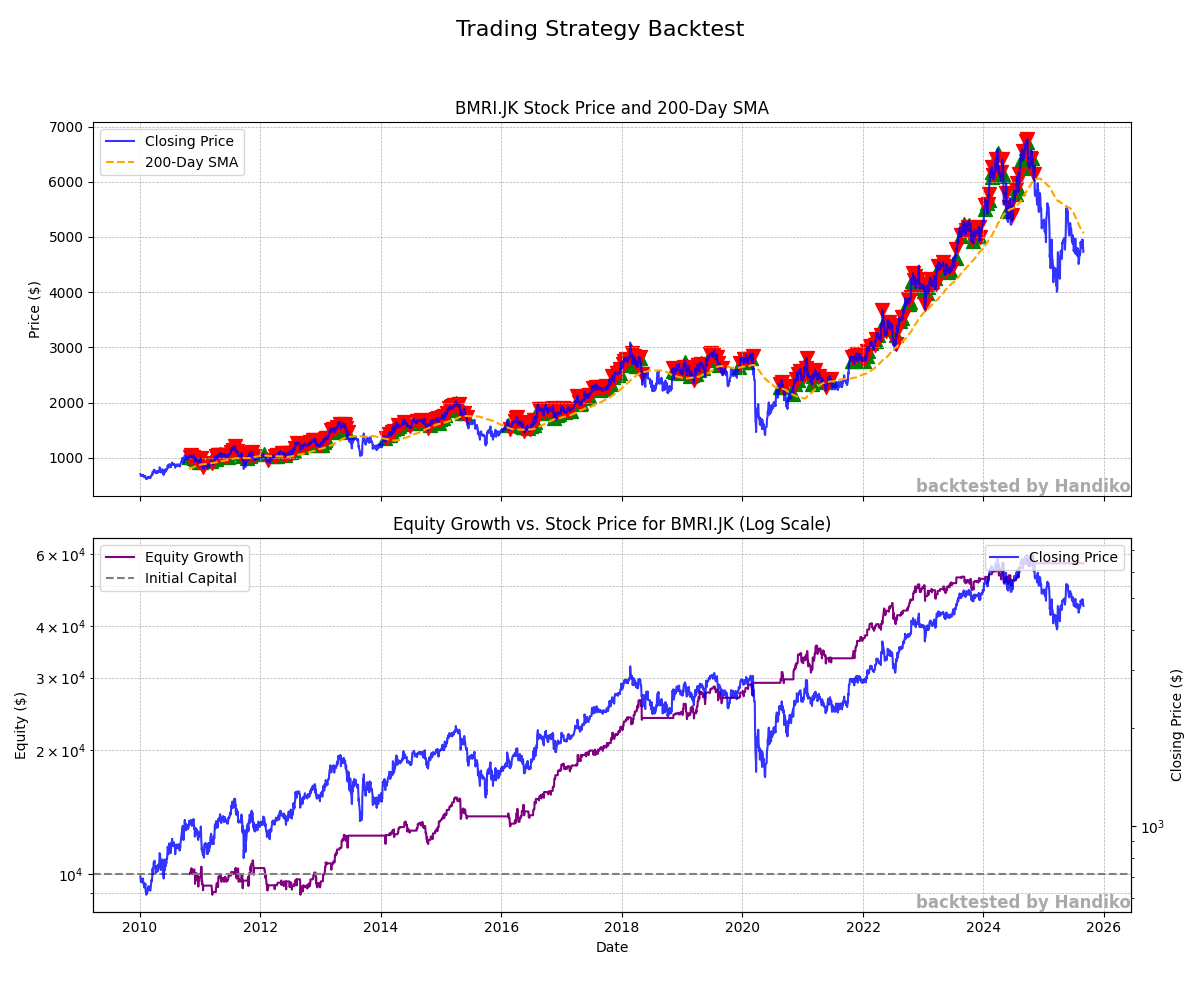
- Visual Analysis: The script generates two comprehensive plots to visualize the strategy’s performance:
- Price and Indicators: Displays the stock’s closing price alongside the 200-day SMA and marks the specific buy (green triangles) and sell (red triangles) points on the chart.
- Equity Growth: Tracks the growth of your simulated trading account’s equity against the stock’s closing price on a logarithmic scale, making it easier to see percentage gains and compare performance.
- Dependency Management: The required libraries—yfinance, pandas, matplotlib, and numpy—are listed at the top for easy installation.
How to Use
Install Dependencies: Make sure you have the necessary libraries installed by running the command:
pip install yfinance pandas matplotlib numpy
Run the Script: Execute the Python script from your terminal:
python your_script_name.py
Analyze the Results: The script will download the data, perform the backtest, print the final results to the console, and save a plot named [ticker_symbol]_trading_strategy_plot.png in the same directory.
Code: here
Important Note on the RSI Period
The script uses a very short 2-period RSI, which is highly sensitive and volatile. While this is used to generate a specific signal, a more conventional RSI period for trading strategies is 14 days, as it provides a smoother, less erratic signal. The use of a 2-period RSI in this script is a deliberate choice for this specific strategy’s logic.
Output Examples
TLKM.JK
BBCA.JK
BBRI.JK
BMRI.JK
Related Project
Back to Index